You leave a recorder in a hedge for a fortnight. It comes back with several thousand hours of audio. Somewhere in there is every bird and bat that passed, and the job is to find out which, and then to convince somebody to pay for the land to stay that way.
WildConnect is the software for the middle of that. Three hundred and forty three commits, all mine, over ten months.
One project on it, a farm on Dartmoor, holds 471,153 detections across 10 sites and 153 days. Seventy seven species, of which three are bats.
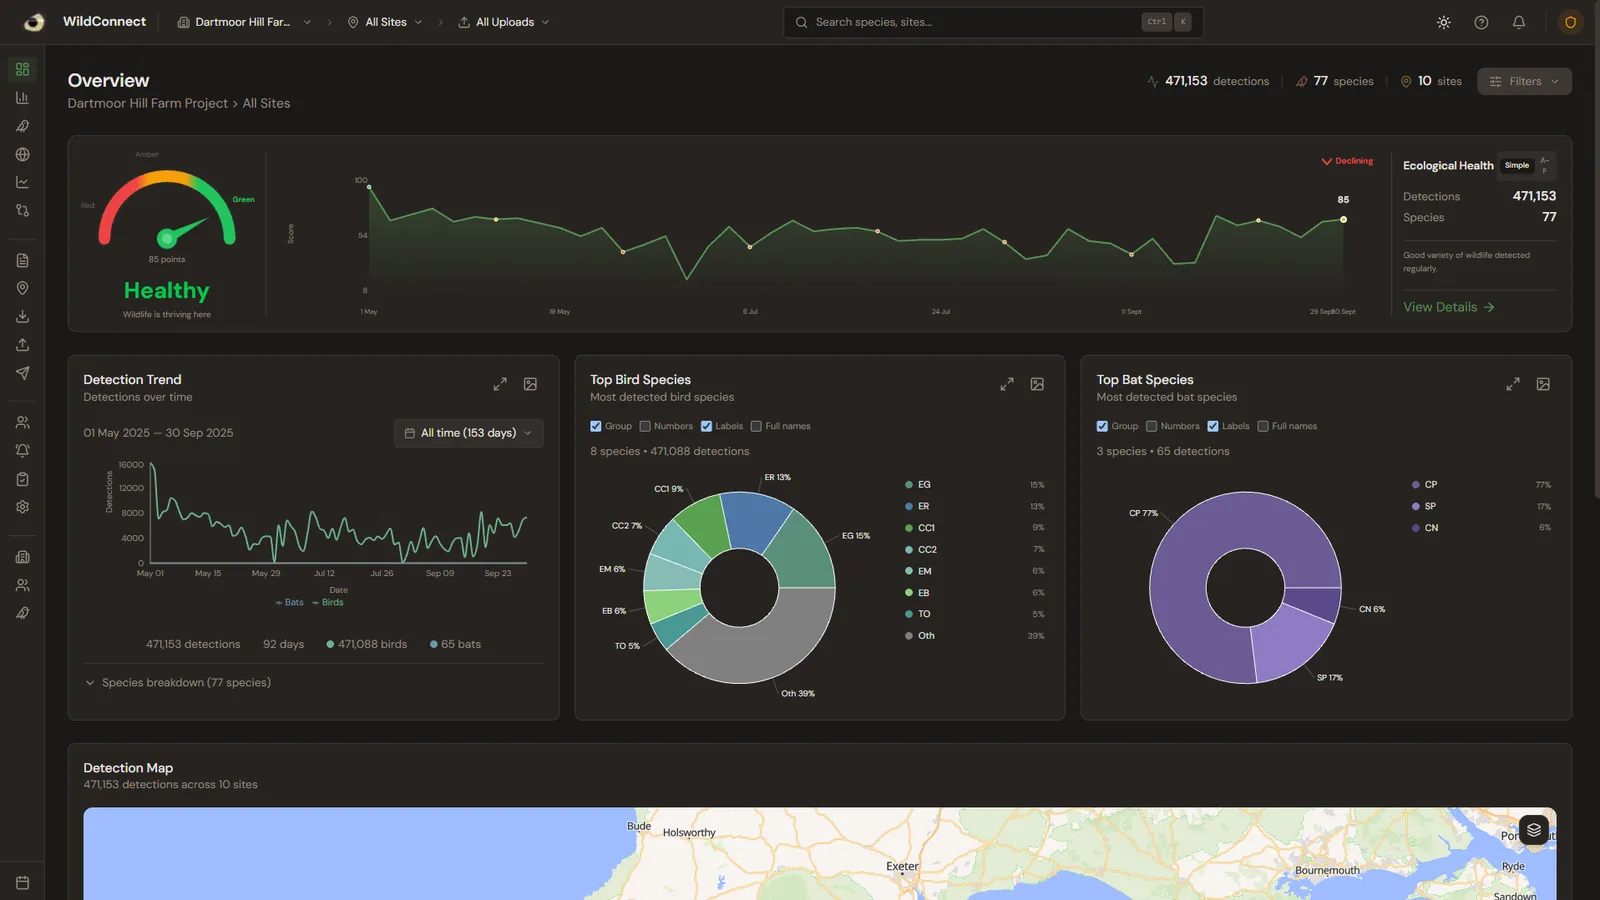 The overview for one farm. The health score is the number a landowner actually asks about
Nobody is reviewing four thousand detections on a phone
The first version assumed the internet. Ecologists work in places that do not have any.
So there is a second application: a self contained bundle an ecologist unzips on a laptop, runs with no connection, and uses to work through a season of recordings in a field or a van. When they get back to a signal, one button pushes the reviewed data up to the live dashboard. Correct detections and things flagged for a second opinion go up as separate uploads, because they mean different things and merging them loses the distinction.
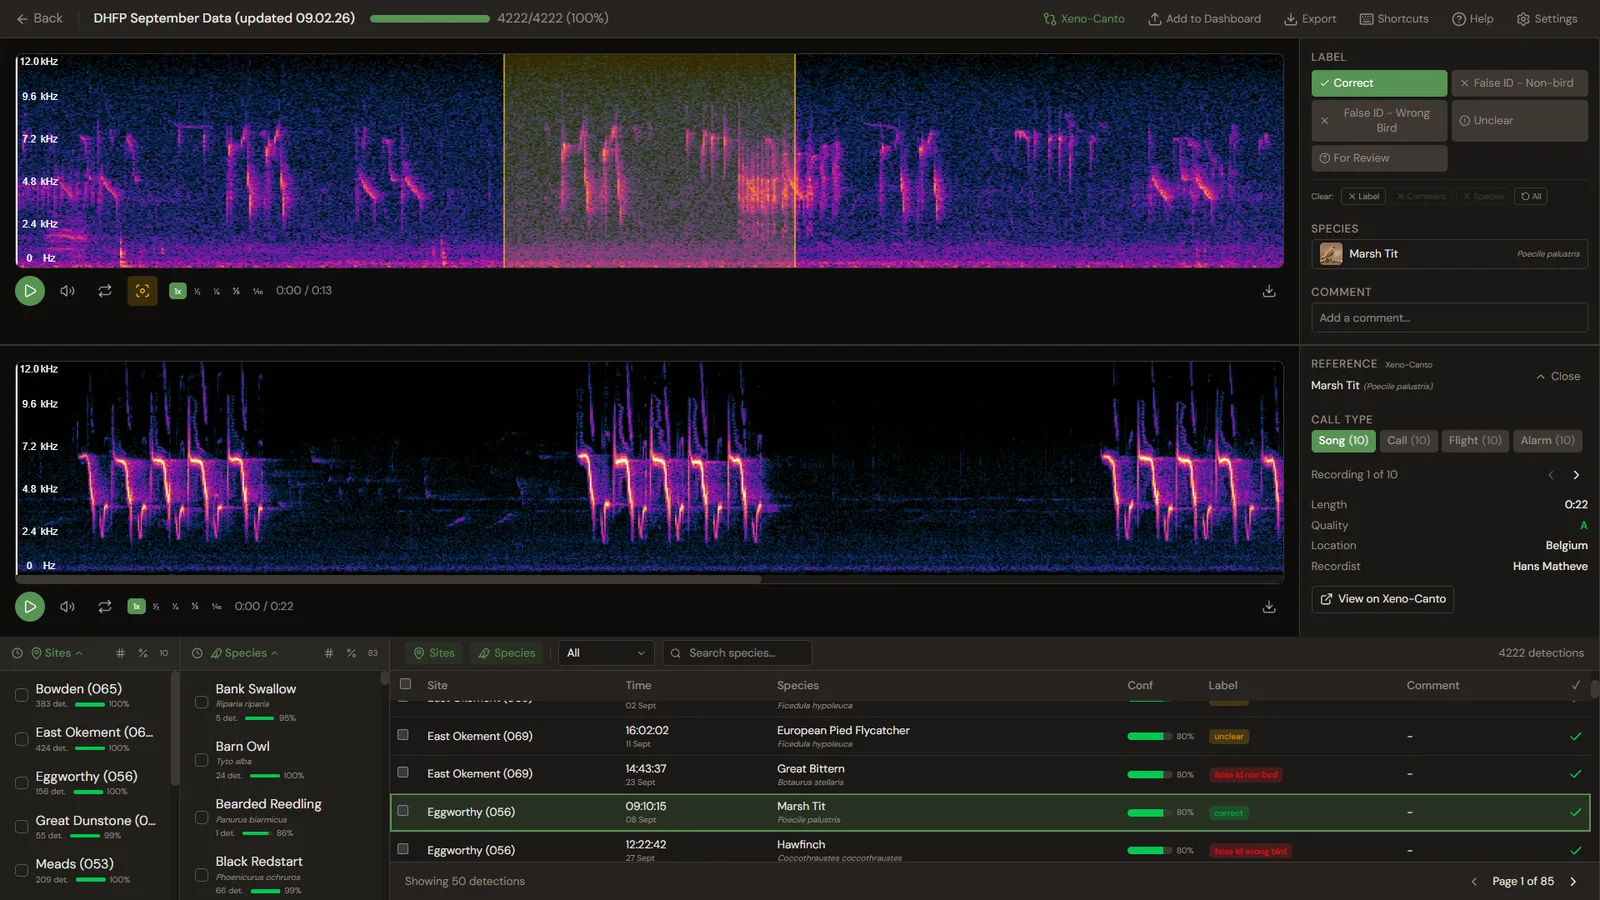 One session, 4,222 detections, reviewed to 100%
The labels are not a yes and a no. They are correct, wrong bird, not a bird at all, unclear, and needs a second opinion. Those distinctions are the point: "not a bird" and "wrong bird" fail differently, and only one of them tells you a rule is missing.
Everything else is built for the fact that this is done four thousand times in a sitting. Keyboard shortcuts throughout, per site progress so you can stop and come back, and the reference recording loaded beside your own so the decision is a comparison rather than a guess.
That bundle is about 700MB. Which matters, because of the puffins.
Cattle keep coming back as Atlantic Puffin
BirdNET is very good and reliably wrong in specific ways. On Dartmoor it hears cattle and reports Atlantic Puffin. Every session, the same false positive, costing real review time.
The fix is a list of species that cannot be where the recorder is. The people who know that are ecologists, not developers, so the list lives in a spreadsheet they maintain themselves. The app does not read the spreadsheet. It reads an endpoint I control that reads the spreadsheet.
That seam is the whole point. A URL compiled into a 700MB zip sitting on somebody's laptop is permanent. If the sheet moves, gets renamed, or somebody adds a column, it is fixed once on the server and every installed copy follows. Nobody has to redownload anything. And a bad edit cannot take the rules down, because the endpoint validates before it serves.
Bats are not birds
Bat calls happen above human hearing and faster than human attention. Played straight they are a click.
The spectrogram view stretches them ten times, runs a 256 point FFT, and labels the frequency axis, so a soprano pipistrelle looks different from a common one on screen rather than in theory. Clips are trimmed to thirteen seconds on upload, which is 1.3 seconds of real time at that expansion, because storing the other fifty seconds of silence for tens of thousands of passes is a bill for nothing.
Proving it is what you say it is
A confidence score is not evidence. What convinces anyone is hearing the recording next to a known one.
Every species page puts your own clip above reference calls pulled from Xeno-Canto, sorted by what kind of call they are: song, contact call, flight call, nocturnal flight call, alarm. Playback runs at full speed or down to a tenth. Alongside it sits the conservation status, so a Common Cuckoo showing 22,618 detections is visibly red listed rather than just another row.
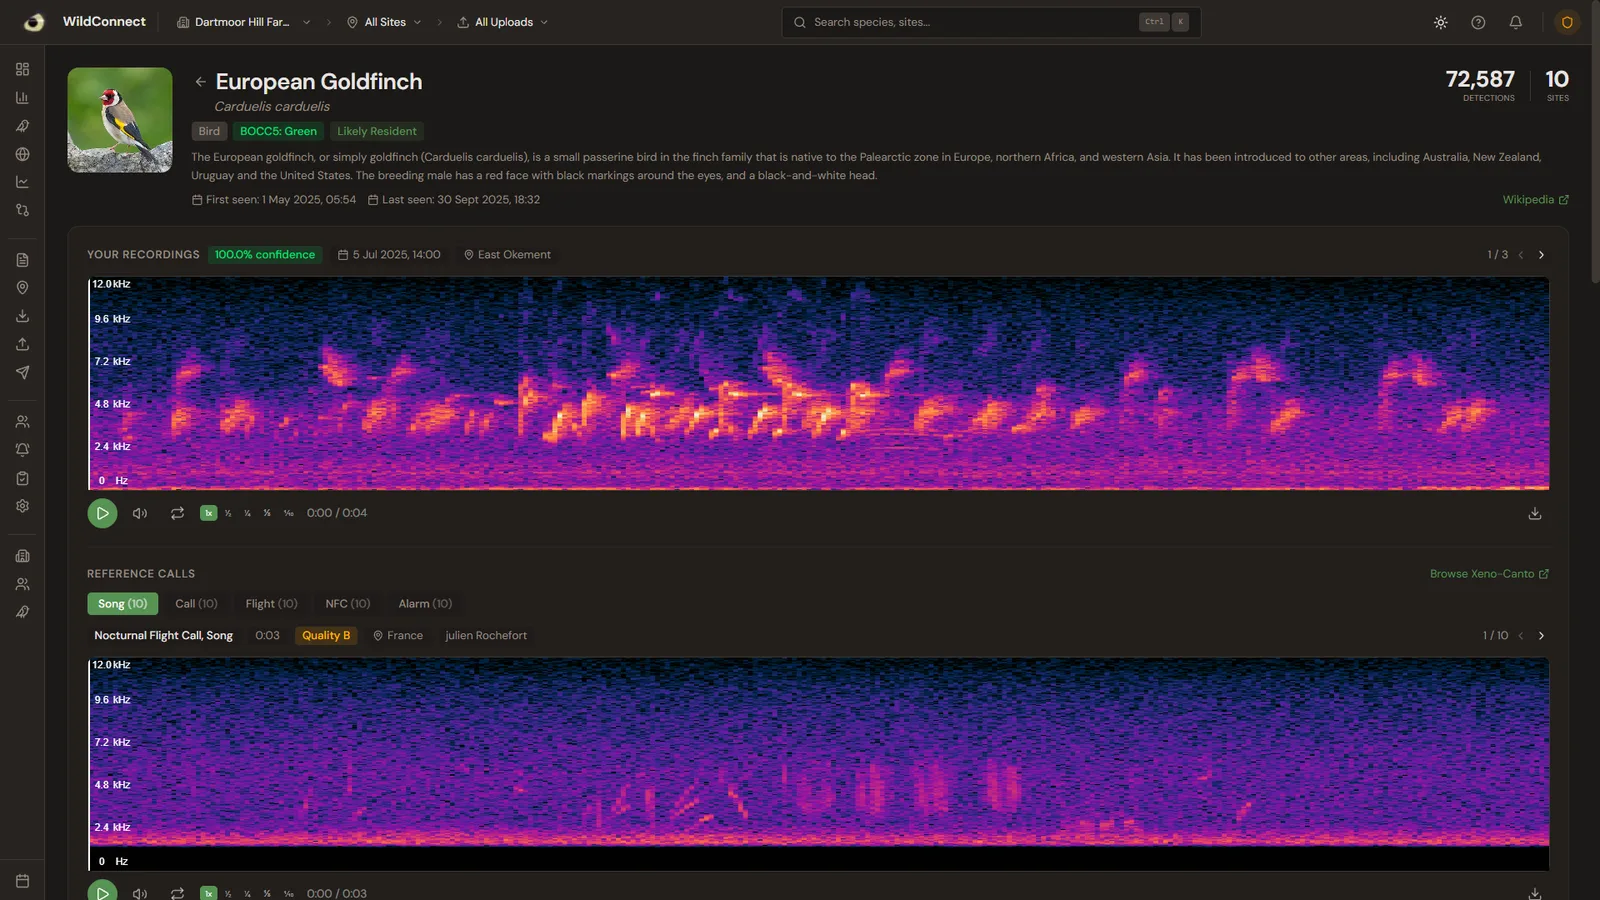 Your recording on top, the reference underneath. That comparison is the whole job of the page
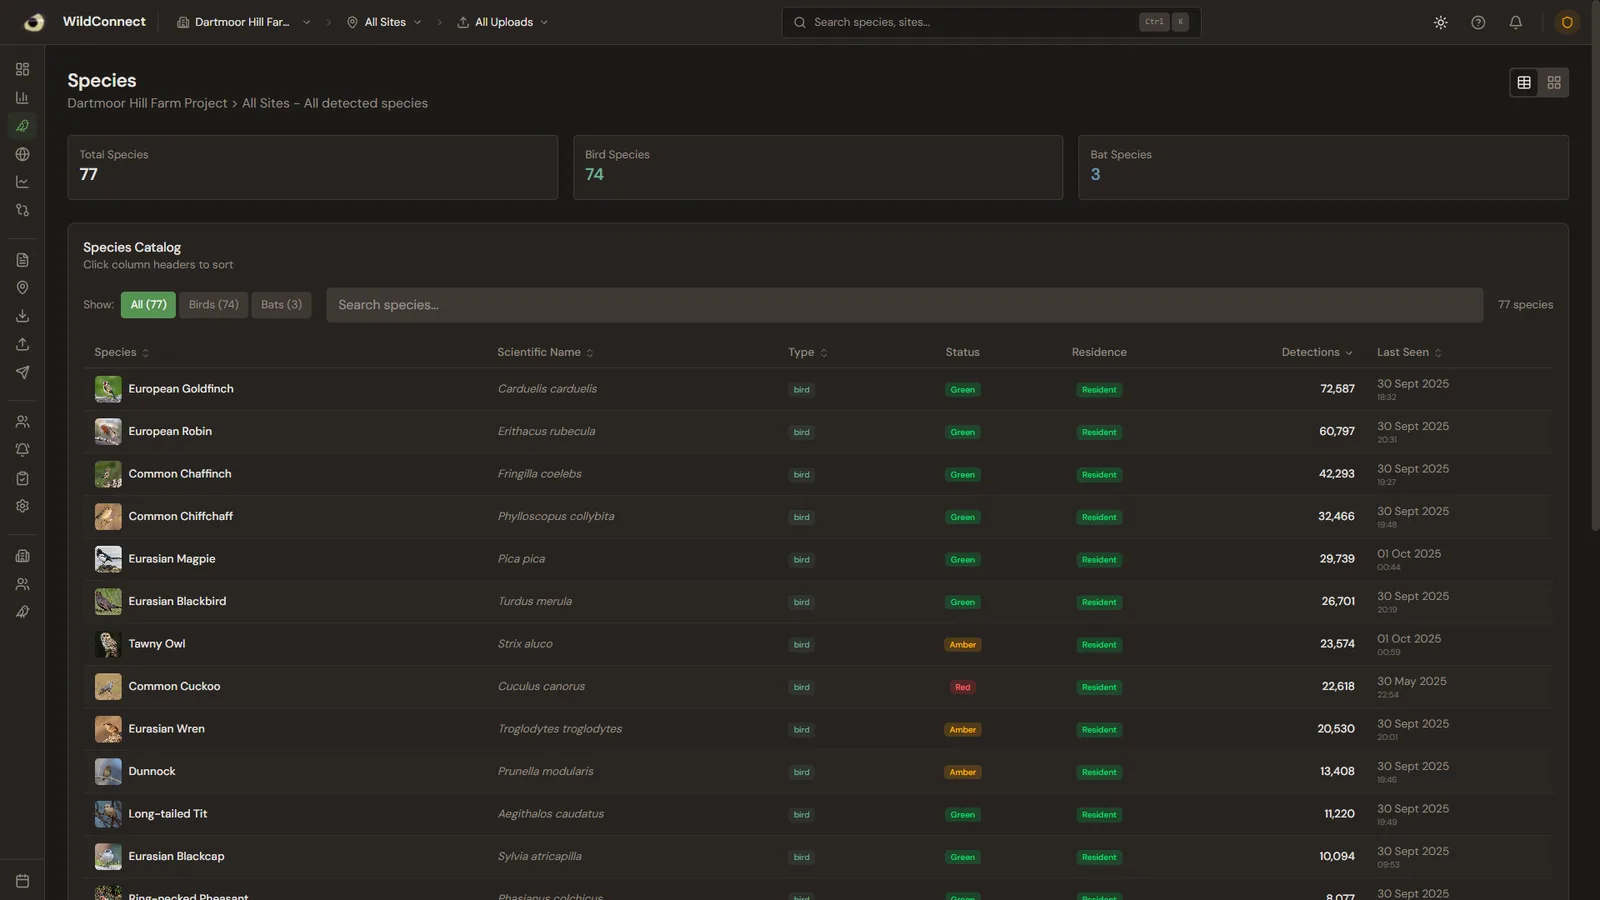 Seventy four birds and three bats, ranked, with red and amber status carried through the list
The dawn chorus has a shape
Aggregate 471,153 detections by hour of day and the dawn chorus draws itself: almost nothing overnight, a wall at five in the morning, a long slow afternoon.
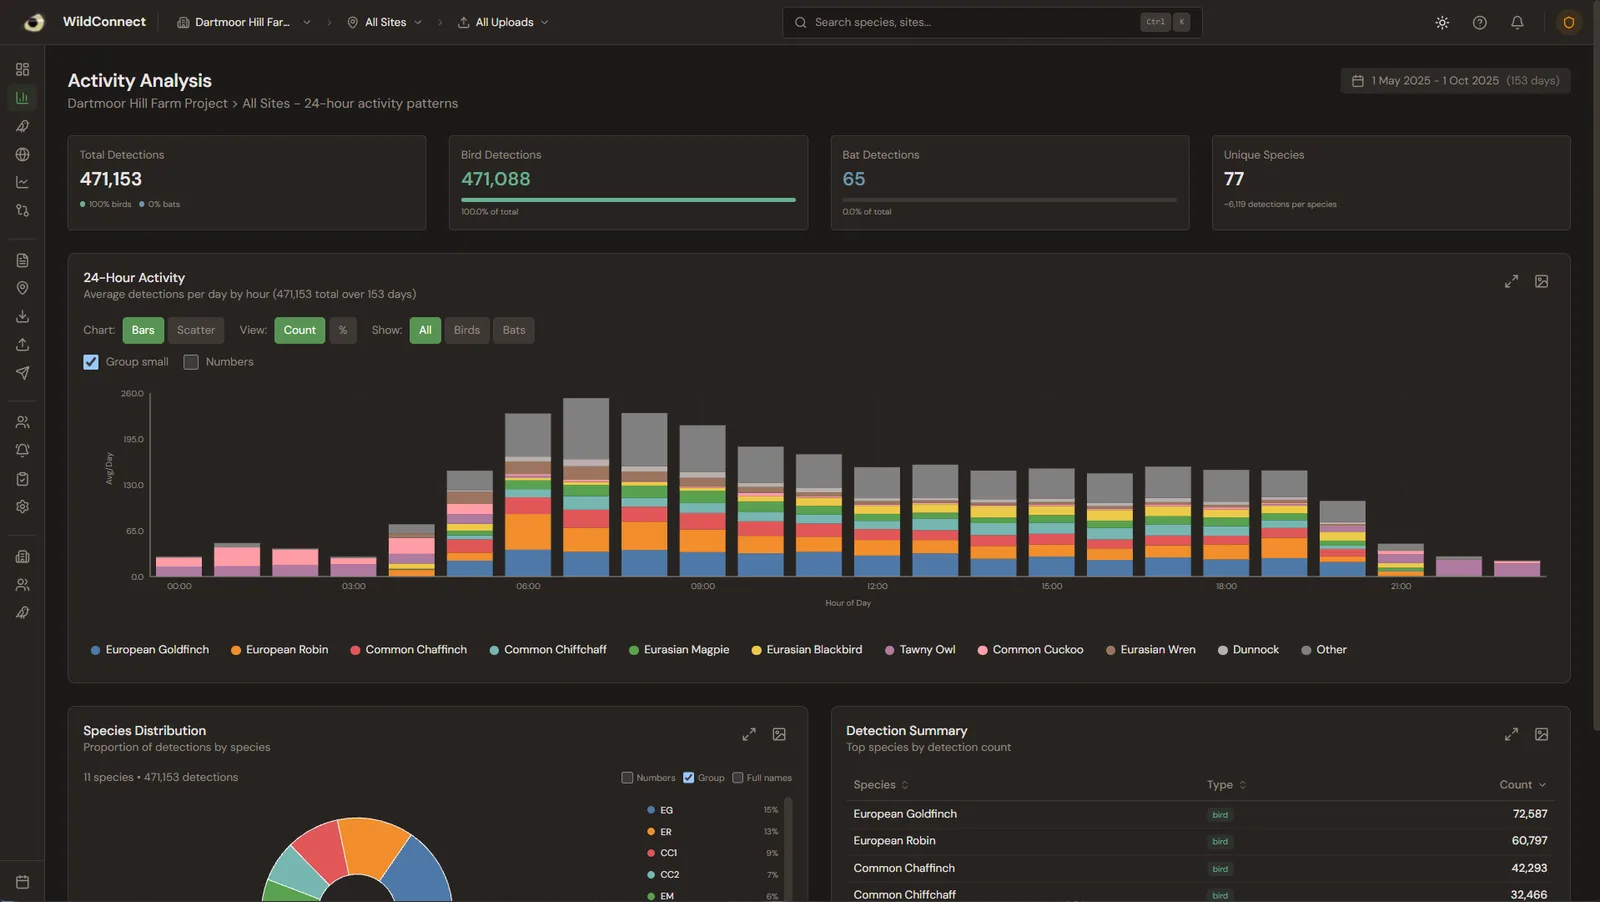 153 days of recordings, folded into 24 hours
Sites cluster on a map, and clicking through goes from ten sites to one hedge.
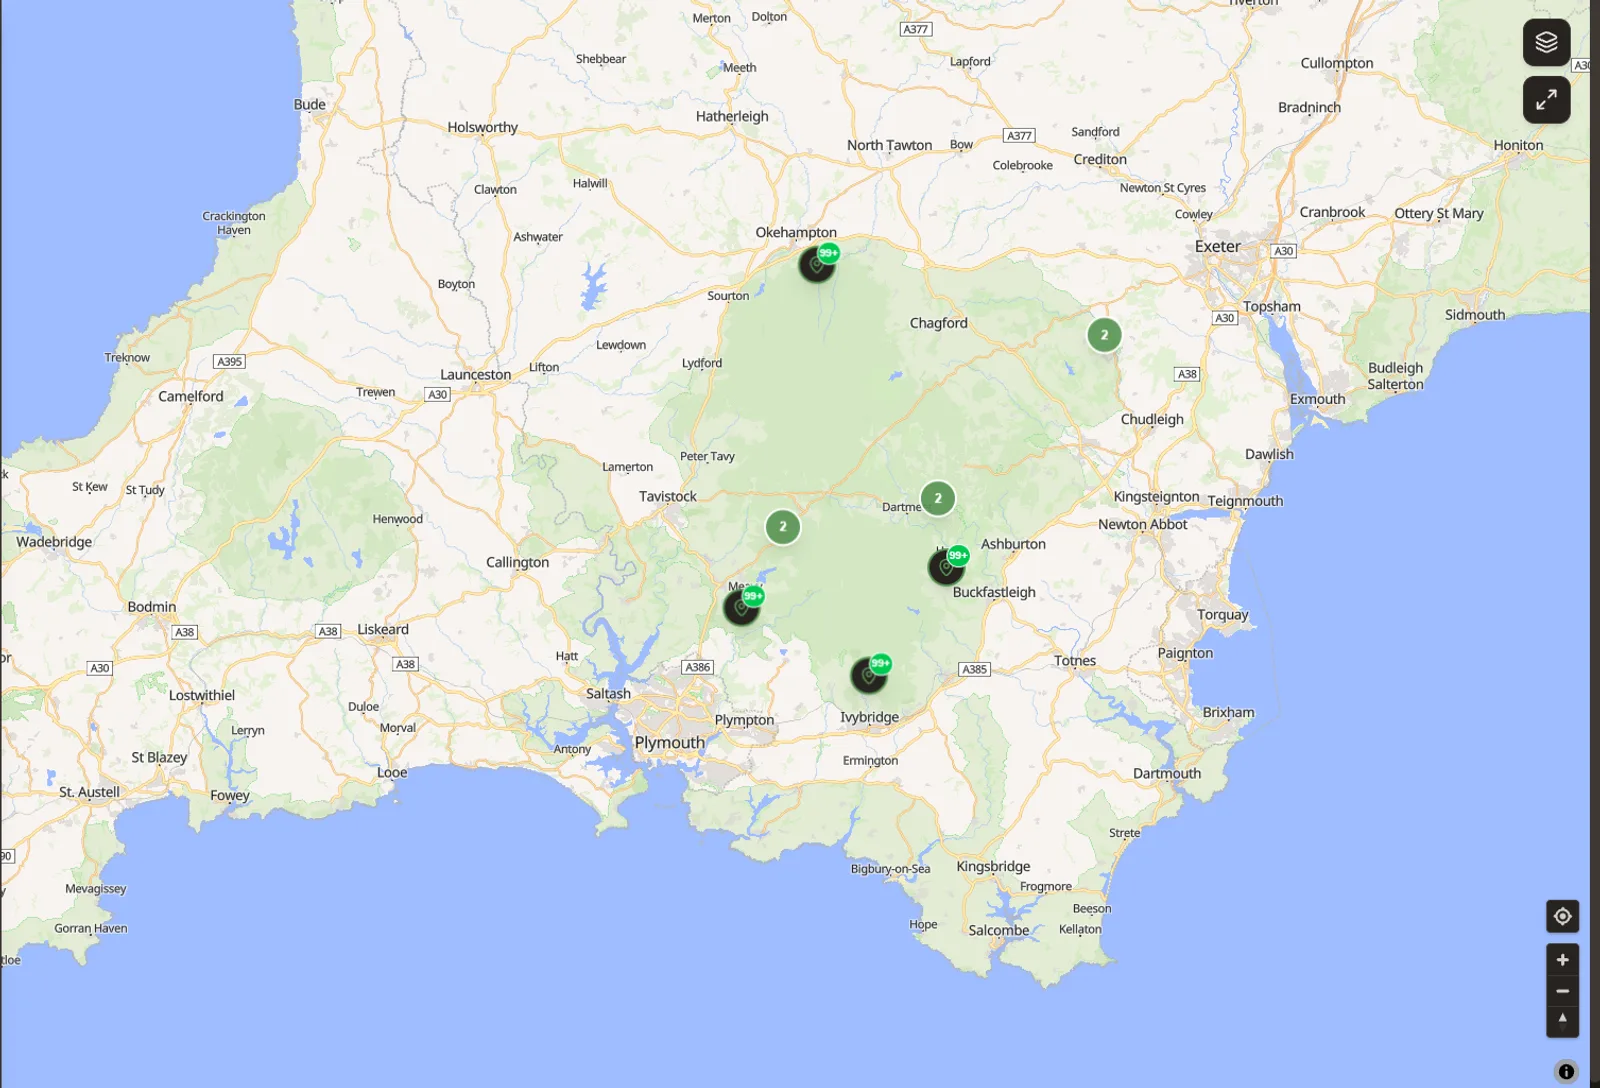 Ten sites on Dartmoor. Coordinates are deliberately not shown here
The database was the hard part
A single organisation can hold millions of detections. The dashboard has to feel instant anyway.
Most of the work nobody sees is there. Materialised views for the aggregates, refreshed immediately when an upload lands and on a schedule every half hour as a backstop. Cursor pagination on the CSV export so a full extract streams instead of timing out. A background job queue for duplicating an organisation, because doing it in a request meant a fifteen minute statement timeout and a spinner nobody trusted. Row level security throughout, four roles, and a student role added so universities can use it without students seeing each other's sites.
The grant calculator
Here is the part I would show first.
Monitoring costs money and produces a spreadsheet of birds. Landowners do not want a spreadsheet of birds. They want to know whether the field pays.
So the calculator takes what the site is, arable, grassland, mixed, several at once, and works out what the government will pay for managing it in ways the monitoring can evidence. Real published rates rather than estimates: £732 a hectare for winter bird food plots, £765 for lapwing nesting plots, £646 for species rich grassland, hedgerows priced per hundred metres. SFI and Countryside Stewardship from DEFRA and GOV.UK, BNG from industry reports, woodland from the Forestry Commission, every source named at the foot of the page.
Then it does the sum nobody else does. Five years of grant income, minus five years of monitoring, and what is left.
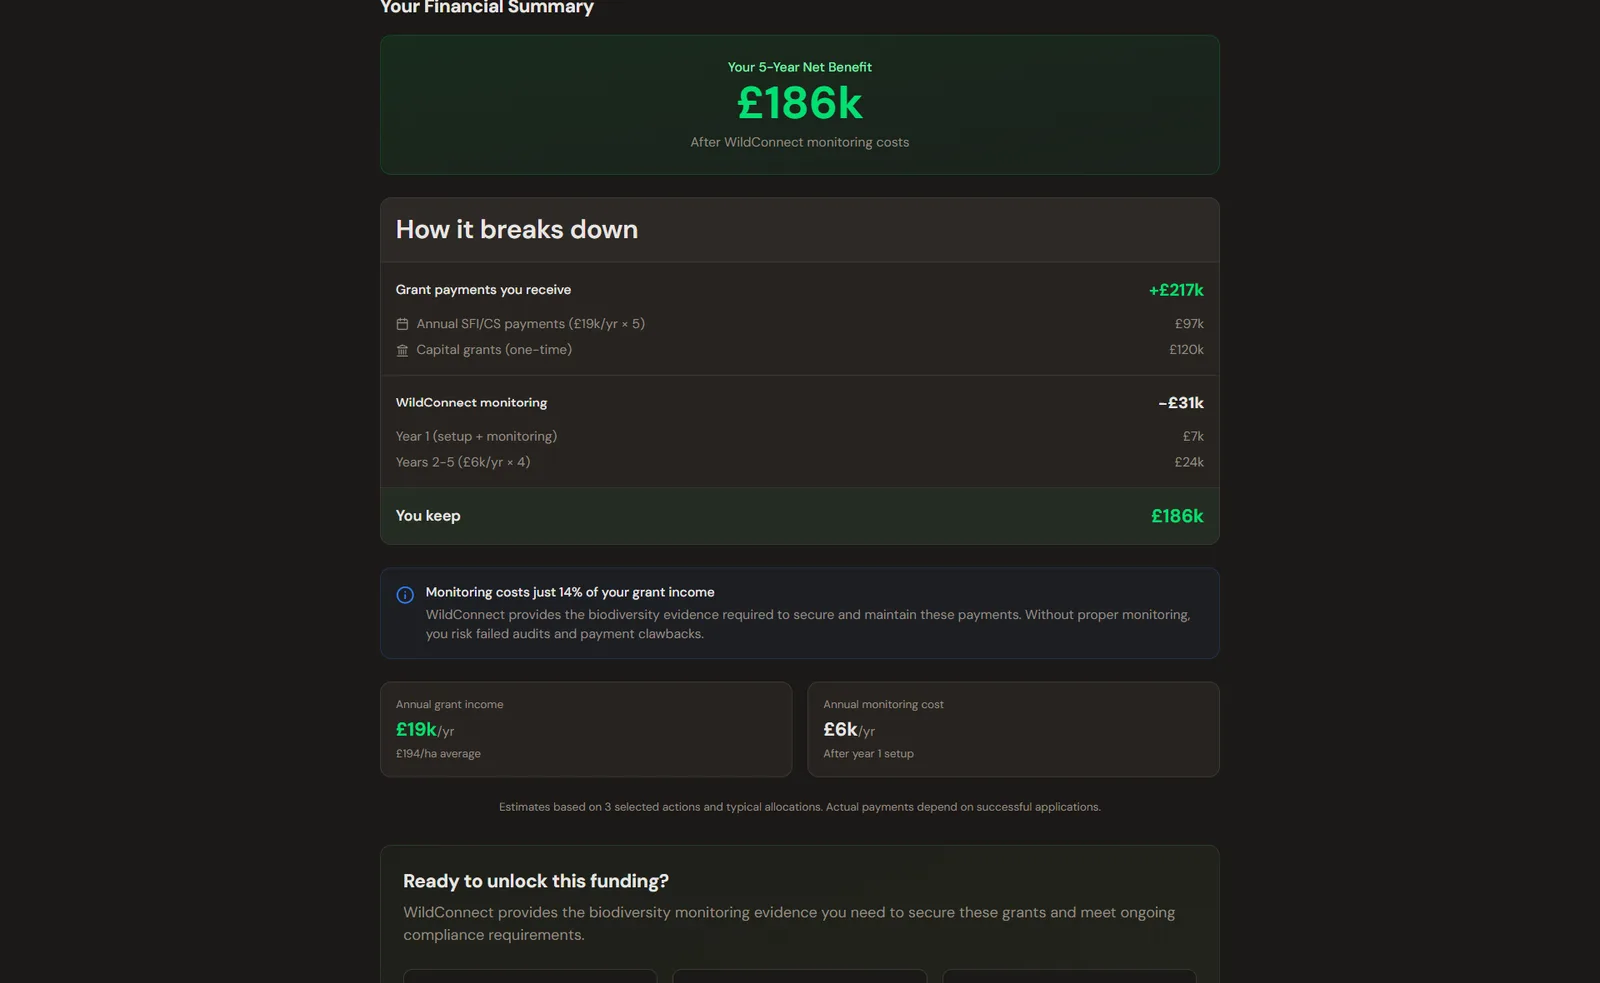 The line that matters is the small one: monitoring costs just 14% of your grant income
For the worked example above that is £217,000 in, £31,000 out, £186,000 kept. The survey stops being a cost and becomes the cheapest line in a funding application, which is the argument the entire platform exists to make.